mirror of
https://github.com/netbox-community/netbox.git
synced 2026-04-15 13:39:54 +02:00
Performance degradation after updating to NetBox 2.7 #3385
Closed
opened 2025-12-29 18:28:37 +01:00 by adam
·
2 comments
No Branch/Tag Specified
main
21866-sql
post-raw-signal
feature
21782-config
21361-tests
21157-export-template-public-models
21025-pre-render-config-contexts
21364-swagger
feature-ip-prefix-link
20911-dropdown-3
fix_module_substitution
21160-filterset
20911-dropdown-2
20044-elevation-stuck-lightmode
7604-filter-modifiers-v3
20660-script-load
19724-graphql
14884-script
19720-macaddress-interface-generic-relation
fix-19669-api-image-download
7604-filter-modifiers
19275-fixes-interface-bulk-edit
fix-17794-get_field_value_return_list
11507-show-aggregate-and-rir-on-api
9583-add_column_specific_search_field_to_tables
v4.6.0-beta1
v4.5.8
v4.5.7
v4.5.6
v4.5.5
v4.5.4
v4.5.3
v4.5.2
v4.5.1
v4.5.0
v4.4.10
v4.4.9
v4.5.0-beta1
v4.4.8
v4.4.7
v4.4.6
v4.4.5
v4.4.4
v4.4.3
v4.4.2
v4.4.1
v4.4.0
v4.3.7
v4.4.0-beta1
v4.3.6
v4.3.5
v4.3.4
v4.3.3
v4.3.2
v4.3.1
v4.3.0
v4.2.9
v4.3.0-beta2
v4.2.8
v4.3.0-beta1
v4.2.7
v4.2.6
v4.2.5
v4.2.4
v4.2.3
v4.2.2
v4.2.1
v4.2.0
v4.1.11
v4.1.10
v4.1.9
v4.1.8
v4.2-beta1
v4.1.7
v4.1.6
v4.1.5
v4.1.4
v4.1.3
v4.1.2
v4.1.1
v4.1.0
v4.0.11
v4.0.10
v4.0.9
v4.1-beta1
v4.0.8
v4.0.7
v4.0.6
v4.0.5
v4.0.3
v4.0.2
v4.0.1
v4.0.0
v3.7.8
v3.7.7
v4.0-beta2
v3.7.6
v3.7.5
v4.0-beta1
v3.7.4
v3.7.3
v3.7.2
v3.7.1
v3.7.0
v3.6.9
v3.6.8
v3.6.7
v3.7-beta1
v3.6.6
v3.6.5
v3.6.4
v3.6.3
v3.6.2
v3.6.1
v3.6.0
v3.5.9
v3.6-beta2
v3.5.8
v3.6-beta1
v3.5.7
v3.5.6
v3.5.5
v3.5.4
v3.5.3
v3.5.2
v3.5.1
v3.5.0
v3.4.10
v3.4.9
v3.5-beta2
v3.4.8
v3.5-beta1
v3.4.7
v3.4.6
v3.4.5
v3.4.4
v3.4.3
v3.4.2
v3.4.1
v3.4.0
v3.3.10
v3.3.9
v3.4-beta1
v3.3.8
v3.3.7
v3.3.6
v3.3.5
v3.3.4
v3.3.3
v3.3.2
v3.3.1
v3.3.0
v3.2.9
v3.2.8
v3.3-beta2
v3.2.7
v3.3-beta1
v3.2.6
v3.2.5
v3.2.4
v3.2.3
v3.2.2
v3.2.1
v3.2.0
v3.1.11
v3.1.10
v3.2-beta2
v3.1.9
v3.2-beta1
v3.1.8
v3.1.7
v3.1.6
v3.1.5
v3.1.4
v3.1.3
v3.1.2
v3.1.1
v3.1.0
v3.0.12
v3.0.11
v3.0.10
v3.1-beta1
v3.0.9
v3.0.8
v3.0.7
v3.0.6
v3.0.5
v3.0.4
v3.0.3
v3.0.2
v3.0.1
v3.0.0
v2.11.12
v3.0-beta2
v2.11.11
v2.11.10
v3.0-beta1
v2.11.9
v2.11.8
v2.11.7
v2.11.6
v2.11.5
v2.11.4
v2.11.3
v2.11.2
v2.11.1
v2.11.0
v2.10.10
v2.10.9
v2.11-beta1
v2.10.8
v2.10.7
v2.10.6
v2.10.5
v2.10.4
v2.10.3
v2.10.2
v2.10.1
v2.10.0
v2.9.11
v2.10-beta2
v2.9.10
v2.10-beta1
v2.9.9
v2.9.8
v2.9.7
v2.9.6
v2.9.5
v2.9.4
v2.9.3
v2.9.2
v2.9.1
v2.9.0
v2.9-beta2
v2.8.9
v2.9-beta1
v2.8.8
v2.8.7
v2.8.6
v2.8.5
v2.8.4
v2.8.3
v2.8.2
v2.8.1
v2.8.0
v2.7.12
v2.7.11
v2.7.10
v2.7.9
v2.7.8
v2.7.7
v2.7.6
v2.7.5
v2.7.4
v2.7.3
v2.7.2
v2.7.1
v2.7.0
v2.6.12
v2.6.11
v2.6.10
v2.6.9
v2.7-beta1
Solcon-2020-01-06
v2.6.8
v2.6.7
v2.6.6
v2.6.5
v2.6.4
v2.6.3
v2.6.2
v2.6.1
v2.6.0
v2.5.13
v2.5.12
v2.6-beta1
v2.5.11
v2.5.10
v2.5.9
v2.5.8
v2.5.7
v2.5.6
v2.5.5
v2.5.4
v2.5.3
v2.5.2
v2.5.1
v2.5.0
v2.4.9
v2.5-beta2
v2.4.8
v2.5-beta1
v2.4.7
v2.4.6
v2.4.5
v2.4.4
v2.4.3
v2.4.2
v2.4.1
v2.4.0
v2.3.7
v2.4-beta1
v2.3.6
v2.3.5
v2.3.4
v2.3.3
v2.3.2
v2.3.1
v2.3.0
v2.2.10
v2.3-beta2
v2.2.9
v2.3-beta1
v2.2.8
v2.2.7
v2.2.6
v2.2.5
v2.2.4
v2.2.3
v2.2.2
v2.2.1
v2.2.0
v2.1.6
v2.2-beta2
v2.1.5
v2.2-beta1
v2.1.4
v2.1.3
v2.1.2
v2.1.1
v2.1.0
v2.0.10
v2.1-beta1
v2.0.9
v2.0.8
v2.0.7
v2.0.6
v2.0.5
v2.0.4
v2.0.3
v2.0.2
v2.0.1
v2.0.0
v2.0-beta3
v1.9.6
v1.9.5
v2.0-beta2
v1.9.4-r1
v1.9.3
v2.0-beta1
v1.9.2
v1.9.1
v1.9.0-r1
v1.8.4
v1.8.3
v1.8.2
v1.8.1
v1.8.0
v1.7.3
v1.7.2-r1
v1.7.1
v1.7.0
v1.6.3
v1.6.2-r1
v1.6.1-r1
1.6.1
v1.6.0
v1.5.2
v1.5.1
v1.5.0
v1.4.2
v1.4.1
v1.4.0
v1.3.2
v1.3.1
v1.3.0
v1.2.2
v1.2.1
v1.2.0
v1.1.0
v1.0.7-r1
v1.0.7
v1.0.6
v1.0.5
v1.0.4
v1.0.3-r1
v1.0.3
1.0.0
Labels
Clear labels
beta
breaking change
complexity: high
complexity: low
complexity: medium
needs milestone
netbox
pending closure
plugin candidate
pull-request
severity: high
severity: low
severity: medium
status: accepted
status: backlog
status: blocked
status: duplicate
status: needs owner
status: needs triage
status: revisions needed
status: under review
topic: GraphQL
topic: Internationalization
topic: OpenAPI
topic: UI/UX
topic: cabling
topic: event rules
topic: htmx navigation
topic: industrialization
topic: migrations
topic: plugins
topic: scripts
topic: templating
topic: testing
type: bug
type: deprecation
type: documentation
type: feature
type: housekeeping
type: translation
Mirrored from GitHub Pull Request
No Label
Milestone
No items
No Milestone
Projects
Clear projects
No project
Notifications
Due Date
No due date set.
Dependencies
No dependencies set.
Reference: starred/netbox#3385
Reference in New Issue
Block a user
Blocking a user prevents them from interacting with repositories, such as opening or commenting on pull requests or issues. Learn more about blocking a user.
Delete Branch "%!s()"
Deleting a branch is permanent. Although the deleted branch may continue to exist for a short time before it actually gets removed, it CANNOT be undone in most cases. Continue?
Originally created by @karlism on GitHub (Feb 24, 2020).
Environment
Steps to Reproduce
Expected Behavior
Performance to stay the same or improve.
Observed Behavior
Performance degradation.
Let me show you an example of device list API request by
curl:As you can see, one of the requests took 1 minute longer than the rest of them. During this API
curlquery, I can see thatgunicorn, and especiallyredis-serverservices are utilising lots of CPU resources.Nginx logs during these requests:
I'm quite confident that there requests didn't take more than 5 seconds prior to update, but I don't have any precise data to back it up. This NetBox instance currently has 1016 devices.
Relevant NetBox redis configuration is following:
Redis server configuration is default.
We have second instance of NetBox running on different VM in different datacenter (in maintenance mode on read-only replicated PostgreSQL database) and experience same performance issue after upgrade on that instance as well.
@karlism commented on GitHub (Feb 24, 2020):
Following NetBox prometheus metric query also shows severe performance degradation after the update:
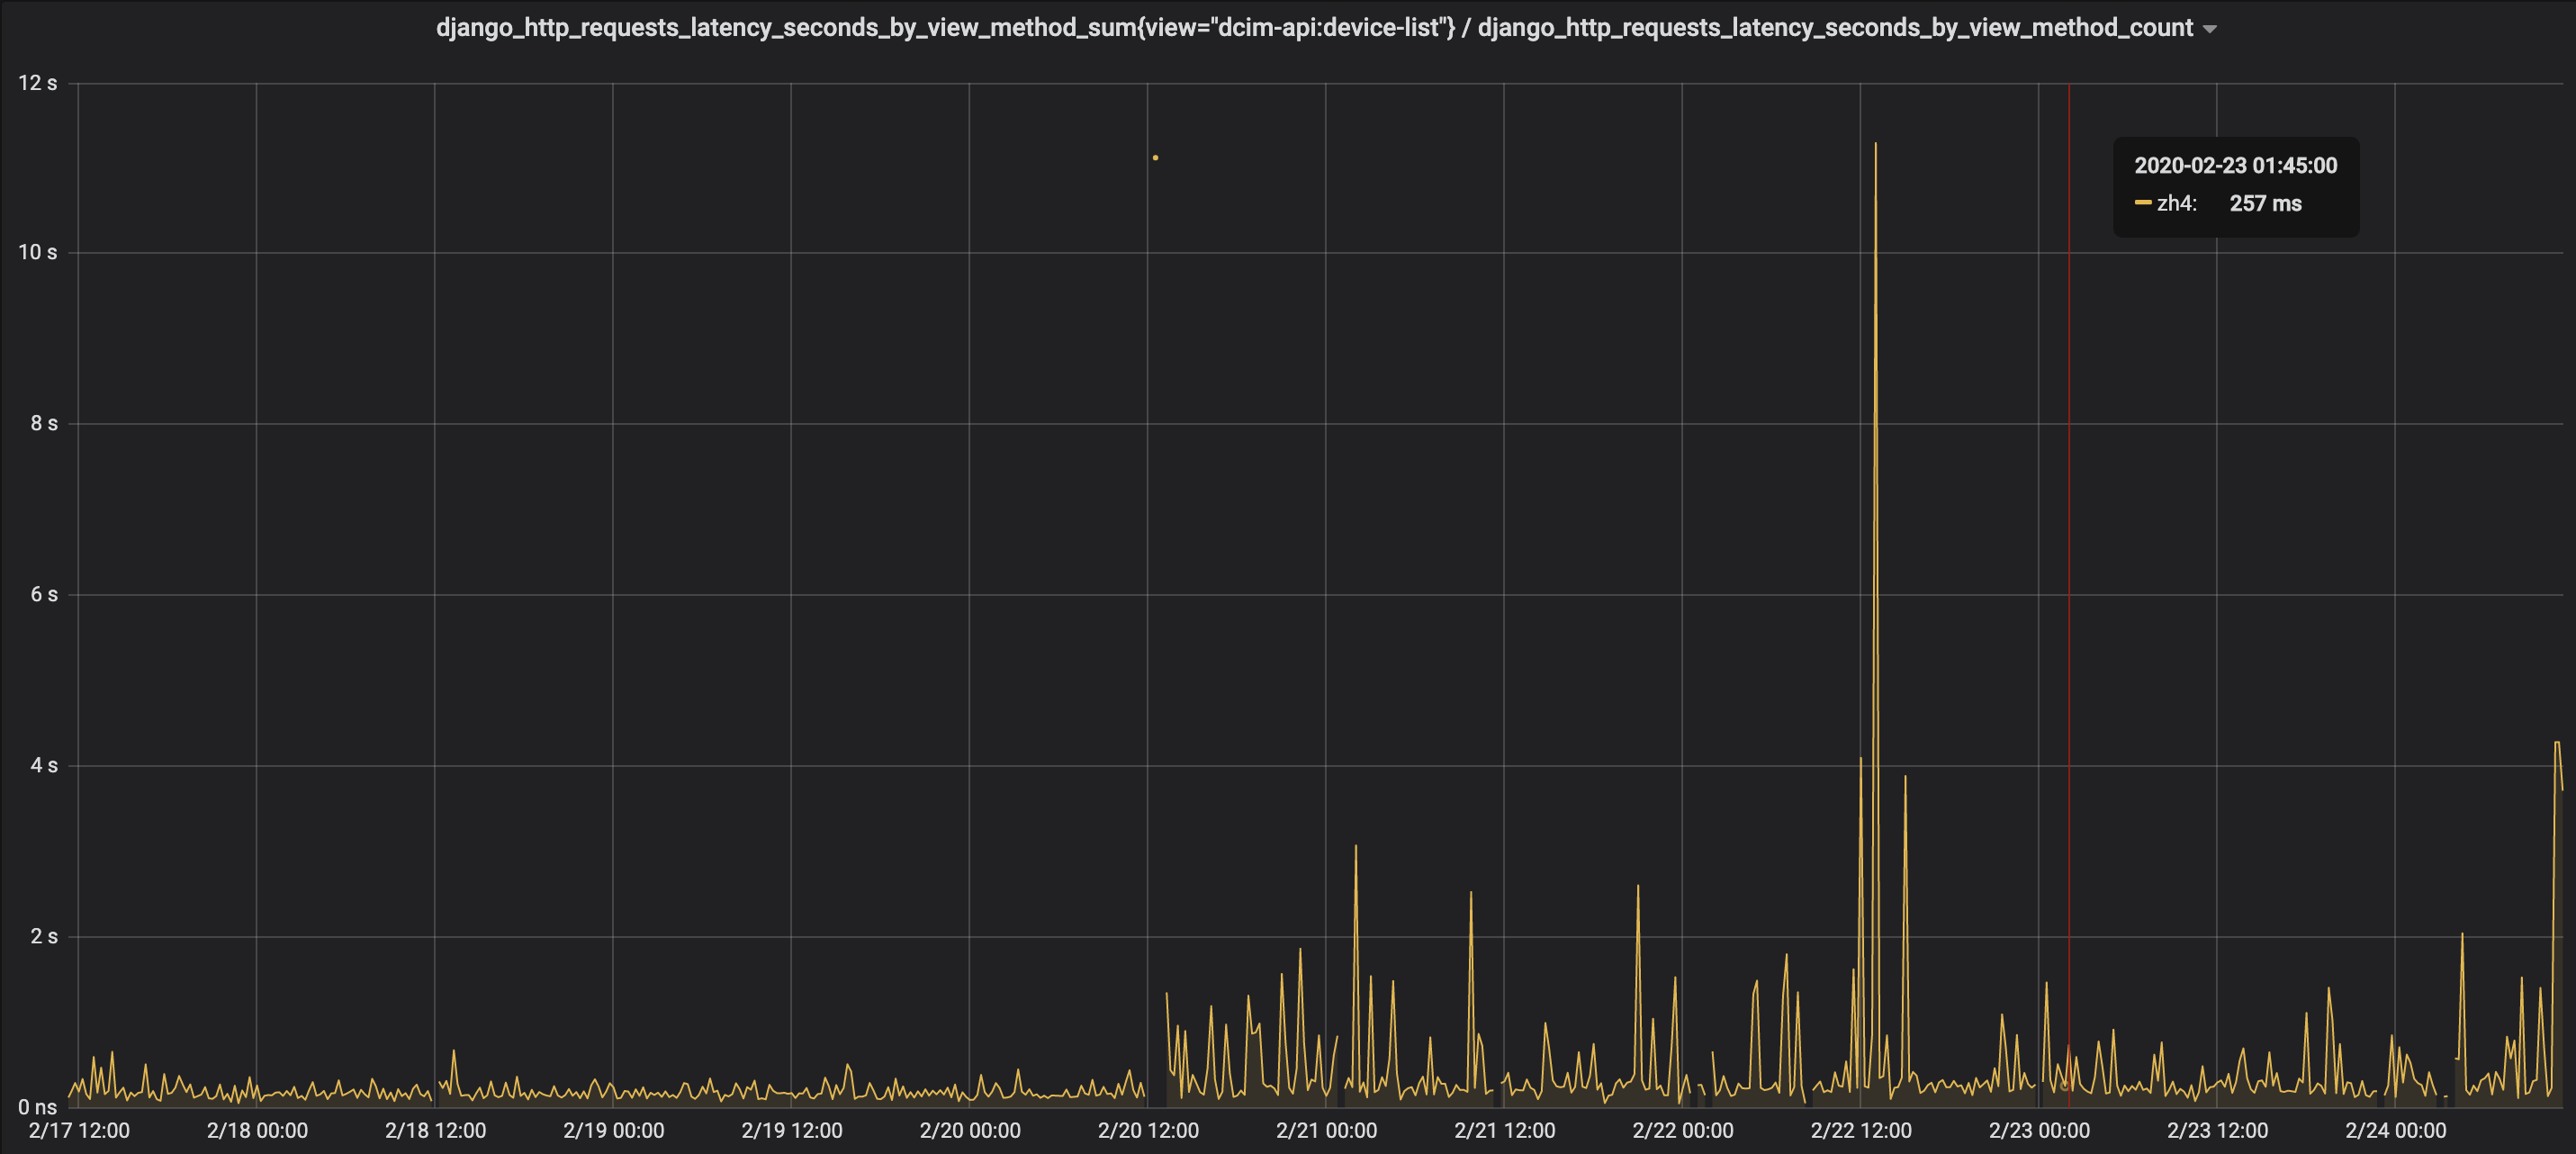
django_http_requests_latency_seconds_by_view_method_sum{view="dcim-api:device-list"} / django_http_requests_latency_seconds_by_view_method_count@jeremystretch commented on GitHub (Feb 24, 2020):
Thank you for your interest in NetBox. GitHub issues are intended for reporting reproducible bugs and requesting features, and must be submitted using one of the templates provided here. For general discussion, questions, or assistance with installation issues, please post to our mailing list instead.