mirror of
https://github.com/netbox-community/netbox.git
synced 2026-03-05 22:10:07 +01:00
Cable tracing starting from patch panels #2237
Closed
opened 2025-12-29 17:24:00 +01:00 by adam
·
2 comments
No Branch/Tag Specified
main
21409-introduce-an-option-to-retain-the-original-create-and-latest
21363-rest-api-cursor-pagination
21330-tags
feature
17654-asn
20915-fix-language-assignment-on-sso-login
19867-preserve-per_page-param
20698-add-a-read-only-vlan-ids-count-to-the-vlanrange-model
21566-user
21468-copy_safe_request-headers
21357-register-model-actions
21025-pre-render-config-contexts
21518-cf-decimal-zero
21331-deprecate-querystring-tag
21364-swagger
20442-callable-audit
feature-ip-prefix-link
20911-dropdown-3
fix_module_substitution
21203-q-attr-denorm
21160-filterset
21118-site
20911-dropdown-2
21102-fix-graphiql-explorer
20044-elevation-stuck-lightmode
v4.5-beta1-release
20068-import-moduletype-attrs
20766-fix-german-translation-code-literals
20378-del-script
7604-filter-modifiers-v3
circuit-swap
12318-case-insensitive-uniqueness
20637-improve-device-q-filter
20660-script-load
19724-graphql
20614-update-ruff
14884-script
02496-max-page
19720-macaddress-interface-generic-relation
19408-circuit-terminations-export-templates
20203-openapi-check
fix-19669-api-image-download
7604-filter-modifiers
19275-fixes-interface-bulk-edit
fix-17794-get_field_value_return_list
11507-show-aggregate-and-rir-on-api
9583-add_column_specific_search_field_to_tables
v4.5.4
v4.5.3
v4.5.2
v4.5.1
v4.5.0
v4.4.10
v4.4.9
v4.5.0-beta1
v4.4.8
v4.4.7
v4.4.6
v4.4.5
v4.4.4
v4.4.3
v4.4.2
v4.4.1
v4.4.0
v4.3.7
v4.4.0-beta1
v4.3.6
v4.3.5
v4.3.4
v4.3.3
v4.3.2
v4.3.1
v4.3.0
v4.2.9
v4.3.0-beta2
v4.2.8
v4.3.0-beta1
v4.2.7
v4.2.6
v4.2.5
v4.2.4
v4.2.3
v4.2.2
v4.2.1
v4.2.0
v4.1.11
v4.1.10
v4.1.9
v4.1.8
v4.2-beta1
v4.1.7
v4.1.6
v4.1.5
v4.1.4
v4.1.3
v4.1.2
v4.1.1
v4.1.0
v4.0.11
v4.0.10
v4.0.9
v4.1-beta1
v4.0.8
v4.0.7
v4.0.6
v4.0.5
v4.0.3
v4.0.2
v4.0.1
v4.0.0
v3.7.8
v3.7.7
v4.0-beta2
v3.7.6
v3.7.5
v4.0-beta1
v3.7.4
v3.7.3
v3.7.2
v3.7.1
v3.7.0
v3.6.9
v3.6.8
v3.6.7
v3.7-beta1
v3.6.6
v3.6.5
v3.6.4
v3.6.3
v3.6.2
v3.6.1
v3.6.0
v3.5.9
v3.6-beta2
v3.5.8
v3.6-beta1
v3.5.7
v3.5.6
v3.5.5
v3.5.4
v3.5.3
v3.5.2
v3.5.1
v3.5.0
v3.4.10
v3.4.9
v3.5-beta2
v3.4.8
v3.5-beta1
v3.4.7
v3.4.6
v3.4.5
v3.4.4
v3.4.3
v3.4.2
v3.4.1
v3.4.0
v3.3.10
v3.3.9
v3.4-beta1
v3.3.8
v3.3.7
v3.3.6
v3.3.5
v3.3.4
v3.3.3
v3.3.2
v3.3.1
v3.3.0
v3.2.9
v3.2.8
v3.3-beta2
v3.2.7
v3.3-beta1
v3.2.6
v3.2.5
v3.2.4
v3.2.3
v3.2.2
v3.2.1
v3.2.0
v3.1.11
v3.1.10
v3.2-beta2
v3.1.9
v3.2-beta1
v3.1.8
v3.1.7
v3.1.6
v3.1.5
v3.1.4
v3.1.3
v3.1.2
v3.1.1
v3.1.0
v3.0.12
v3.0.11
v3.0.10
v3.1-beta1
v3.0.9
v3.0.8
v3.0.7
v3.0.6
v3.0.5
v3.0.4
v3.0.3
v3.0.2
v3.0.1
v3.0.0
v2.11.12
v3.0-beta2
v2.11.11
v2.11.10
v3.0-beta1
v2.11.9
v2.11.8
v2.11.7
v2.11.6
v2.11.5
v2.11.4
v2.11.3
v2.11.2
v2.11.1
v2.11.0
v2.10.10
v2.10.9
v2.11-beta1
v2.10.8
v2.10.7
v2.10.6
v2.10.5
v2.10.4
v2.10.3
v2.10.2
v2.10.1
v2.10.0
v2.9.11
v2.10-beta2
v2.9.10
v2.10-beta1
v2.9.9
v2.9.8
v2.9.7
v2.9.6
v2.9.5
v2.9.4
v2.9.3
v2.9.2
v2.9.1
v2.9.0
v2.9-beta2
v2.8.9
v2.9-beta1
v2.8.8
v2.8.7
v2.8.6
v2.8.5
v2.8.4
v2.8.3
v2.8.2
v2.8.1
v2.8.0
v2.7.12
v2.7.11
v2.7.10
v2.7.9
v2.7.8
v2.7.7
v2.7.6
v2.7.5
v2.7.4
v2.7.3
v2.7.2
v2.7.1
v2.7.0
v2.6.12
v2.6.11
v2.6.10
v2.6.9
v2.7-beta1
Solcon-2020-01-06
v2.6.8
v2.6.7
v2.6.6
v2.6.5
v2.6.4
v2.6.3
v2.6.2
v2.6.1
v2.6.0
v2.5.13
v2.5.12
v2.6-beta1
v2.5.11
v2.5.10
v2.5.9
v2.5.8
v2.5.7
v2.5.6
v2.5.5
v2.5.4
v2.5.3
v2.5.2
v2.5.1
v2.5.0
v2.4.9
v2.5-beta2
v2.4.8
v2.5-beta1
v2.4.7
v2.4.6
v2.4.5
v2.4.4
v2.4.3
v2.4.2
v2.4.1
v2.4.0
v2.3.7
v2.4-beta1
v2.3.6
v2.3.5
v2.3.4
v2.3.3
v2.3.2
v2.3.1
v2.3.0
v2.2.10
v2.3-beta2
v2.2.9
v2.3-beta1
v2.2.8
v2.2.7
v2.2.6
v2.2.5
v2.2.4
v2.2.3
v2.2.2
v2.2.1
v2.2.0
v2.1.6
v2.2-beta2
v2.1.5
v2.2-beta1
v2.1.4
v2.1.3
v2.1.2
v2.1.1
v2.1.0
v2.0.10
v2.1-beta1
v2.0.9
v2.0.8
v2.0.7
v2.0.6
v2.0.5
v2.0.4
v2.0.3
v2.0.2
v2.0.1
v2.0.0
v2.0-beta3
v1.9.6
v1.9.5
v2.0-beta2
v1.9.4-r1
v1.9.3
v2.0-beta1
v1.9.2
v1.9.1
v1.9.0-r1
v1.8.4
v1.8.3
v1.8.2
v1.8.1
v1.8.0
v1.7.3
v1.7.2-r1
v1.7.1
v1.7.0
v1.6.3
v1.6.2-r1
v1.6.1-r1
1.6.1
v1.6.0
v1.5.2
v1.5.1
v1.5.0
v1.4.2
v1.4.1
v1.4.0
v1.3.2
v1.3.1
v1.3.0
v1.2.2
v1.2.1
v1.2.0
v1.1.0
v1.0.7-r1
v1.0.7
v1.0.6
v1.0.5
v1.0.4
v1.0.3-r1
v1.0.3
1.0.0
Labels
Clear labels
beta
breaking change
complexity: high
complexity: low
complexity: medium
needs milestone
netbox
pending closure
plugin candidate
pull-request
severity: high
severity: low
severity: medium
status: accepted
status: backlog
status: blocked
status: duplicate
status: needs owner
status: needs triage
status: revisions needed
status: under review
topic: GraphQL
topic: Internationalization
topic: OpenAPI
topic: UI/UX
topic: cabling
topic: event rules
topic: htmx navigation
topic: industrialization
topic: migrations
topic: plugins
topic: scripts
topic: templating
topic: testing
type: bug
type: deprecation
type: documentation
type: feature
type: housekeeping
type: translation
Mirrored from GitHub Pull Request
No Label
Milestone
No items
No Milestone
Projects
Clear projects
No project
Notifications
Due Date
No due date set.
Dependencies
No dependencies set.
Reference: starred/netbox#2237
Reference in New Issue
Block a user
Blocking a user prevents them from interacting with repositories, such as opening or commenting on pull requests or issues. Learn more about blocking a user.
Delete Branch "%!s()"
Deleting a branch is permanent. Although the deleted branch may continue to exist for a short time before it actually gets removed, it CANNOT be undone in most cases. Continue?
Originally created by @coloHsq on GitHub (Dec 21, 2018).
Environment
Proposed Functionality
Add cable tracing starting from devices that have pass-through ports, generally patch panels.
Use Case
In my case where I have to manage devices located in multiple sites is a very useful feature in case you need detailed reports of devices that use patch panels between two sites.
I've already developed "cable tracing" (including this feature) on Netbox < 2.5 and for me it's very useful
In my custom app all the cable tracing functions are displayed in tables (separated from the device page) to have a complete vision of the situation and not to open the single trace, starting from device
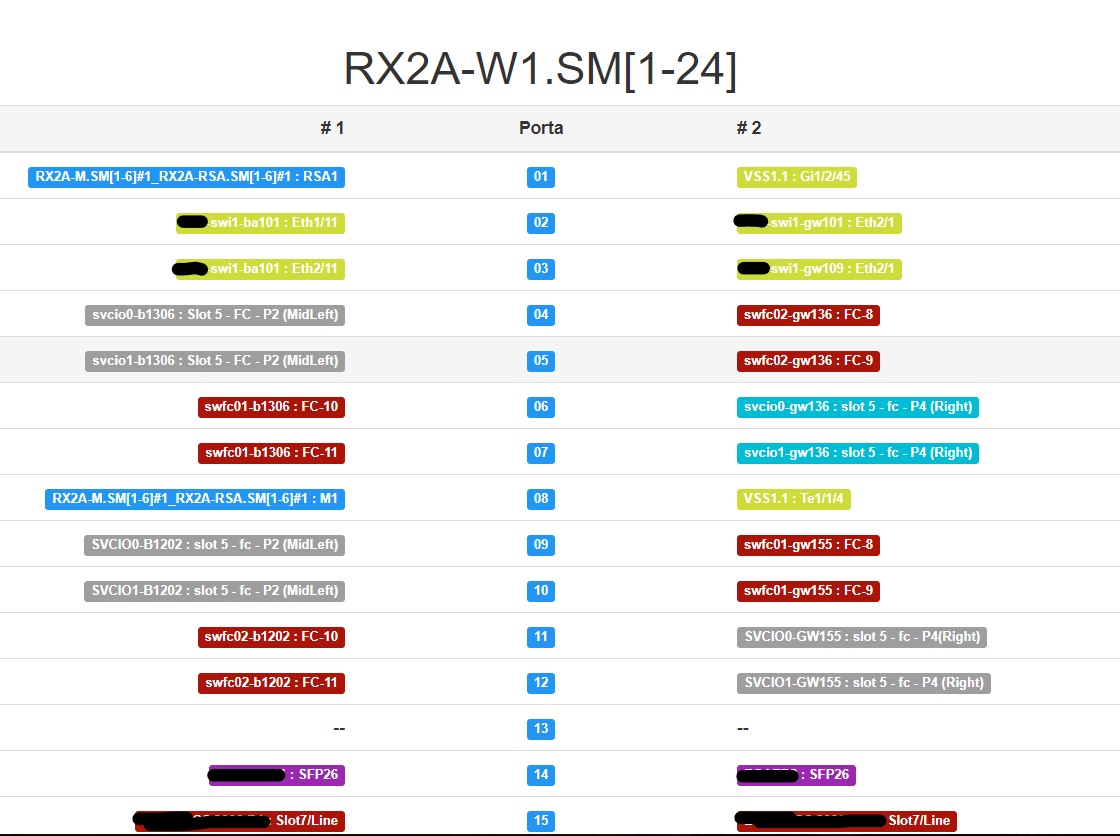
I actually prefer your version, but for this feature, which would actually serve as a report, it would be great have a view like this :
On the first column the end of the trace starting from the front port, in the middle the port name and in the last column the end of the trace starting from the rear port.
Database Changes
None
External Dependencies
None
@jeremystretch commented on GitHub (Dec 21, 2018):
This information is available in the current view. Front and rear port connections are not displayed on the same line both to allow sufficient space and because they are not necessarily mapped one-to-one.
@coloHsq commented on GitHub (Dec 21, 2018):
Forgive me, but I think you haven't correctly understand my request, this feature, that I'm currently using on older version, was designed, in anticipation of some work on a bridge where our fibers pass, to know which devices would have been impacted in case of damage to the fiber (there were not any cables yet, so I made it based on patch panel's interface relations)
Regarding the initial request I realize that it is not so clear. I'll try to explain it better, starting from a patch panel I do the complete trace , like the actual netbox version, but in both directions (first from front, and then from rear), and I display only the terminations (the devices), for example, in the screenshot I've posted, starting from the front port "6", the connection goes through four patch panels and arrives on a fiber channel switch on port 10 (swfc01-b1306 : 10), and this is the termination of the front port trace, while for rear port trace do the same thing on the patch panel connected by trunk to the examinated patch panel.
I hope this is more clear, so you can understand my request.